Home
Fundamentals
Week 1
Week 2
- Overview
- Q1 - Integer Distance
- Q2 - Largest Double
- Q3 - Evaluating Boolean Values
- Q4 - Face-Printing

- Q5 - Quadratic Equations
- Q6 - Polar Coordinates
- Q7 - Safer Fixed Divider
- Q8 - Safer Quadratic Solver
- Q9 - Squares Loop
- Q10 - Lopsided Number Triangle
- Q11 - Gambler's Ruin
- Q12 - Quadratic Solver With Imaginary Parts
Week 3
- Overview
- Q1 - Floating point division
- Q2 - While loop example - arithmetic series
- Q3 - ArrayRotate
- Q4 - Mean and Variance
- Q5 - Median Temperature
- Q6 - Mode
- Q7 - Sieve of Eratosthenes
Week 4
- Overview
- Q1 - Array Front
- Q2 - Date Fashion
- Q3 - IsTriangular
- Q4 - NMax
- Q5 - CoordinateConverter
- Q6 - ArrayOps
- Q7 - Error Handling
- Q8 - One Time Pad
- Q9 - Factorial Recursion
Week 5
- Overview
- Q1 - No Triples
- Q2 - Has 271
- Q3 - Nesting Nightmare
- Q4 - N-by-N Matrix
- Q5 - Path Names
- Q6 - Voronoi Diagram
Week 6
- Overview
- Q1 - Daleks
- Q2 - Arrays and Reference Types
- Q3 - Make your Own CreditCard
- Q4 - DNA Strand
- Q5 - Vector3D
- Q6 - Image Editor
Week 7
- Overview
- Q1 - Daleks Again
- Q2 - Arrays and Reference Types
- Q3 - Reading in files
- Q4 - Interval
- Q5 - Shapes
- Q6 - Text Analysis
- Q7 - Noughts-And-Crosses
Week 9
Week 10
Advanced
Java Class Design
Advanced Class Design
Object-Oriented Design Principles
Generics and Collections
String Processing
Exceptions and Assertions
Java I/O Fundamentals
Java File I/O (NIO.2)
Databases with JDBC
Threads
Concurrency
Localization
Android Development
Resources
Java Files

This exercise is reserved for pair programming in the live lab sessions.
Please skip it when doing the exercises individually.
In this question we will create a Voronoi diagram for a set of 2D points. Here is an example of a Voronoi diagram:
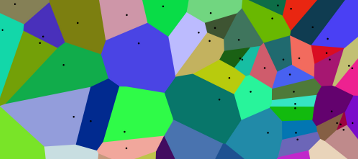
The basic idea has been credited to Descartes, who claimed that the solar system consists of vortices, that is, a decomposition of space into convex regions, each consisting of matter revolving round one of the fixed stars. On this view, we start off with a space \( M \), together with a subset \( S \) of points \( p \) in \( M \) called sites. Each site \( p \) exerts influence on other points \( x \) in \( M \). Then the region of \( p \) is the set of points for which the influence of \( p \) is strongest, relative to all sites in \( S \).
Such a region is also known as a Voronoi cell, which is defined as the set of all points in the given space whose distance to the site is less than than their distance to the other sites.
To construct a visualisation of a Voronoi diagram, we start of by representing the sites as black dots. Each site is associated with a specific colour; for example, the site in the top left corner of the diagram above is associated with greeny-grey, the dot below and to the left of that is associated with cyan, and so on. Next, we visit each pixel in the image, and decide which site that pixel is closest to, and give that pixel the colour that is associated with the site.
This exercise uses the StdDraw library to plot the diagram. You may want to check the API for the StdDraw library.
We will break the exercise down into tasks, and we will be separating the calculation of the colours from the drawing of the diagram. To carry out this calculation, we will create a variable indexmap of type int[][] to represent every pixel in the image. In this two-dimensional array of ints, an index [i][j] represents the coordinates (i, j) of a pixel in the image. The value indexmap[i][j] represents the site that is closest to that pixel; in other words, it tells us which Voronoi cell the pixel belongs to.
Here is a skeleton of the class Voronoi:
import java.awt.Color;

public class Voronoi {

    public static double pointDist(Point2D point1, Point2D point2) {
        // ADD CODE HERE
    }

    public static int findClosestPoint(Point2D point, Point2D[] sites) {
        // ADD CODE HERE
    }

    public static int[][] buildVoronoiMap(Point2D[] sites, int width, int height) {
        // ADD CODE HERE
    }

    public static void plotVoronoiMap(Point2D[] sites, Color[] colors, int[][] indexMap) {
        // ADD CODE HERE
    }

    public static void main(String[] args) {
        int width = 200;
        int height = 200;

        int nSites = 5;
        Point2D[] sites = new Point2D[nSites];
        sites[0] = new Point2D(50, 50);
        sites[1] = new Point2D(100, 50);
        sites[2] = new Point2D(50, 100);
        sites[3] = new Point2D(125, 50);
        sites[4] = new Point2D(100, 175);

        Color[] colors = new Color[nSites];
        colors[0] = Color.BLUE;
        colors[1] = Color.GREEN;
        colors[2] = Color.YELLOW;
        colors[3] = Color.ORANGE;
        colors[4] = Color.MAGENTA;

        int[][] indexmap = buildVoronoiMap(sites, width, height);
        plotVoronoiMap(sites, colors, indexmap);

    }

}
Before examining the various static method in the body of the class, it is a good idea to look closely at the ‘client code’ in main(). We begin by setting values for the width and height of the diagram that we want to construct; these values are passed as arguments to buildVoronoiMap(). We have also decided to use only five sites, which are initialized in the array sites. Corresponding to each site sites[i] there will be a colour colors[i]; e.g., the site with coordinates (100, 50) is associated with the colour green. This use of two parallel arrays is poor programming style, but is adequate for current purposes. Once we have built imagemap, we pass this as an argument to the plotting method that draws the diagram.
You will need use the class Point2D for storing 2-dimensional points with their coordinates. Save the following code into a file called Point2D.java, and make sure that it is in the same directory as your Voronoi.java file.
public class Point2D {

    private int x;
    private int y;

    public Point2D(int x, int y) {
        this.x = x;
        this.y = y;
    }

    public int getX() {
        return x;
    }

    public int getY() {
        return y;
    }

}
Your task now is to implement the API for the class Voronoi as follows:
- public static double pointDist(Point2D point1, Point2D point2)
- Return the Euclidean distance between point1 and point2.
- public static int findClosestPoint(Point2D point, Point2D[] sites)
- Given a 2D point (corresponding to a pixel) and a list sites of Voronoi sites, calculate the distance between point and each site in sites, and return the index i such that sites[i] is the site closest to point.
- public static int[][] buildVoronoiMap(Point2D[] sites, int width, int height)
- Create a new indexmap of type int[][] described earlier, with width and height given by width and height, and assign each pixel the index of the point in sites closest to that pixel. Return indexmap.
- public static void plotVoronoiMap(Point2D[] points, Color[] colors, int[][] indexMap)
-
Transform the indexmap into coloured pixels via the StdDraw library, then plot the locations of each point as a visible black dot. You will need the following code to set the dimensions of the diagram:
int width = indexMap.length;
int height = indexMap[0].length;

StdDraw.setCanvasSize(width, height);
StdDraw.setXscale(0, width);
StdDraw.setYscale(0, height);
Use StdDraw.setPenColor() to pick the colour of the pixel, and StdDraw.point(i, j) to draw a pixel at coordinates (i, j). Once you have plotted all the points, set the pen color to Color.BLACK and use StdDraw.filledCircle() with size around 3 to plot each of the sites.
An automated test has been created for this exercise: VoronoiTest.java.