|
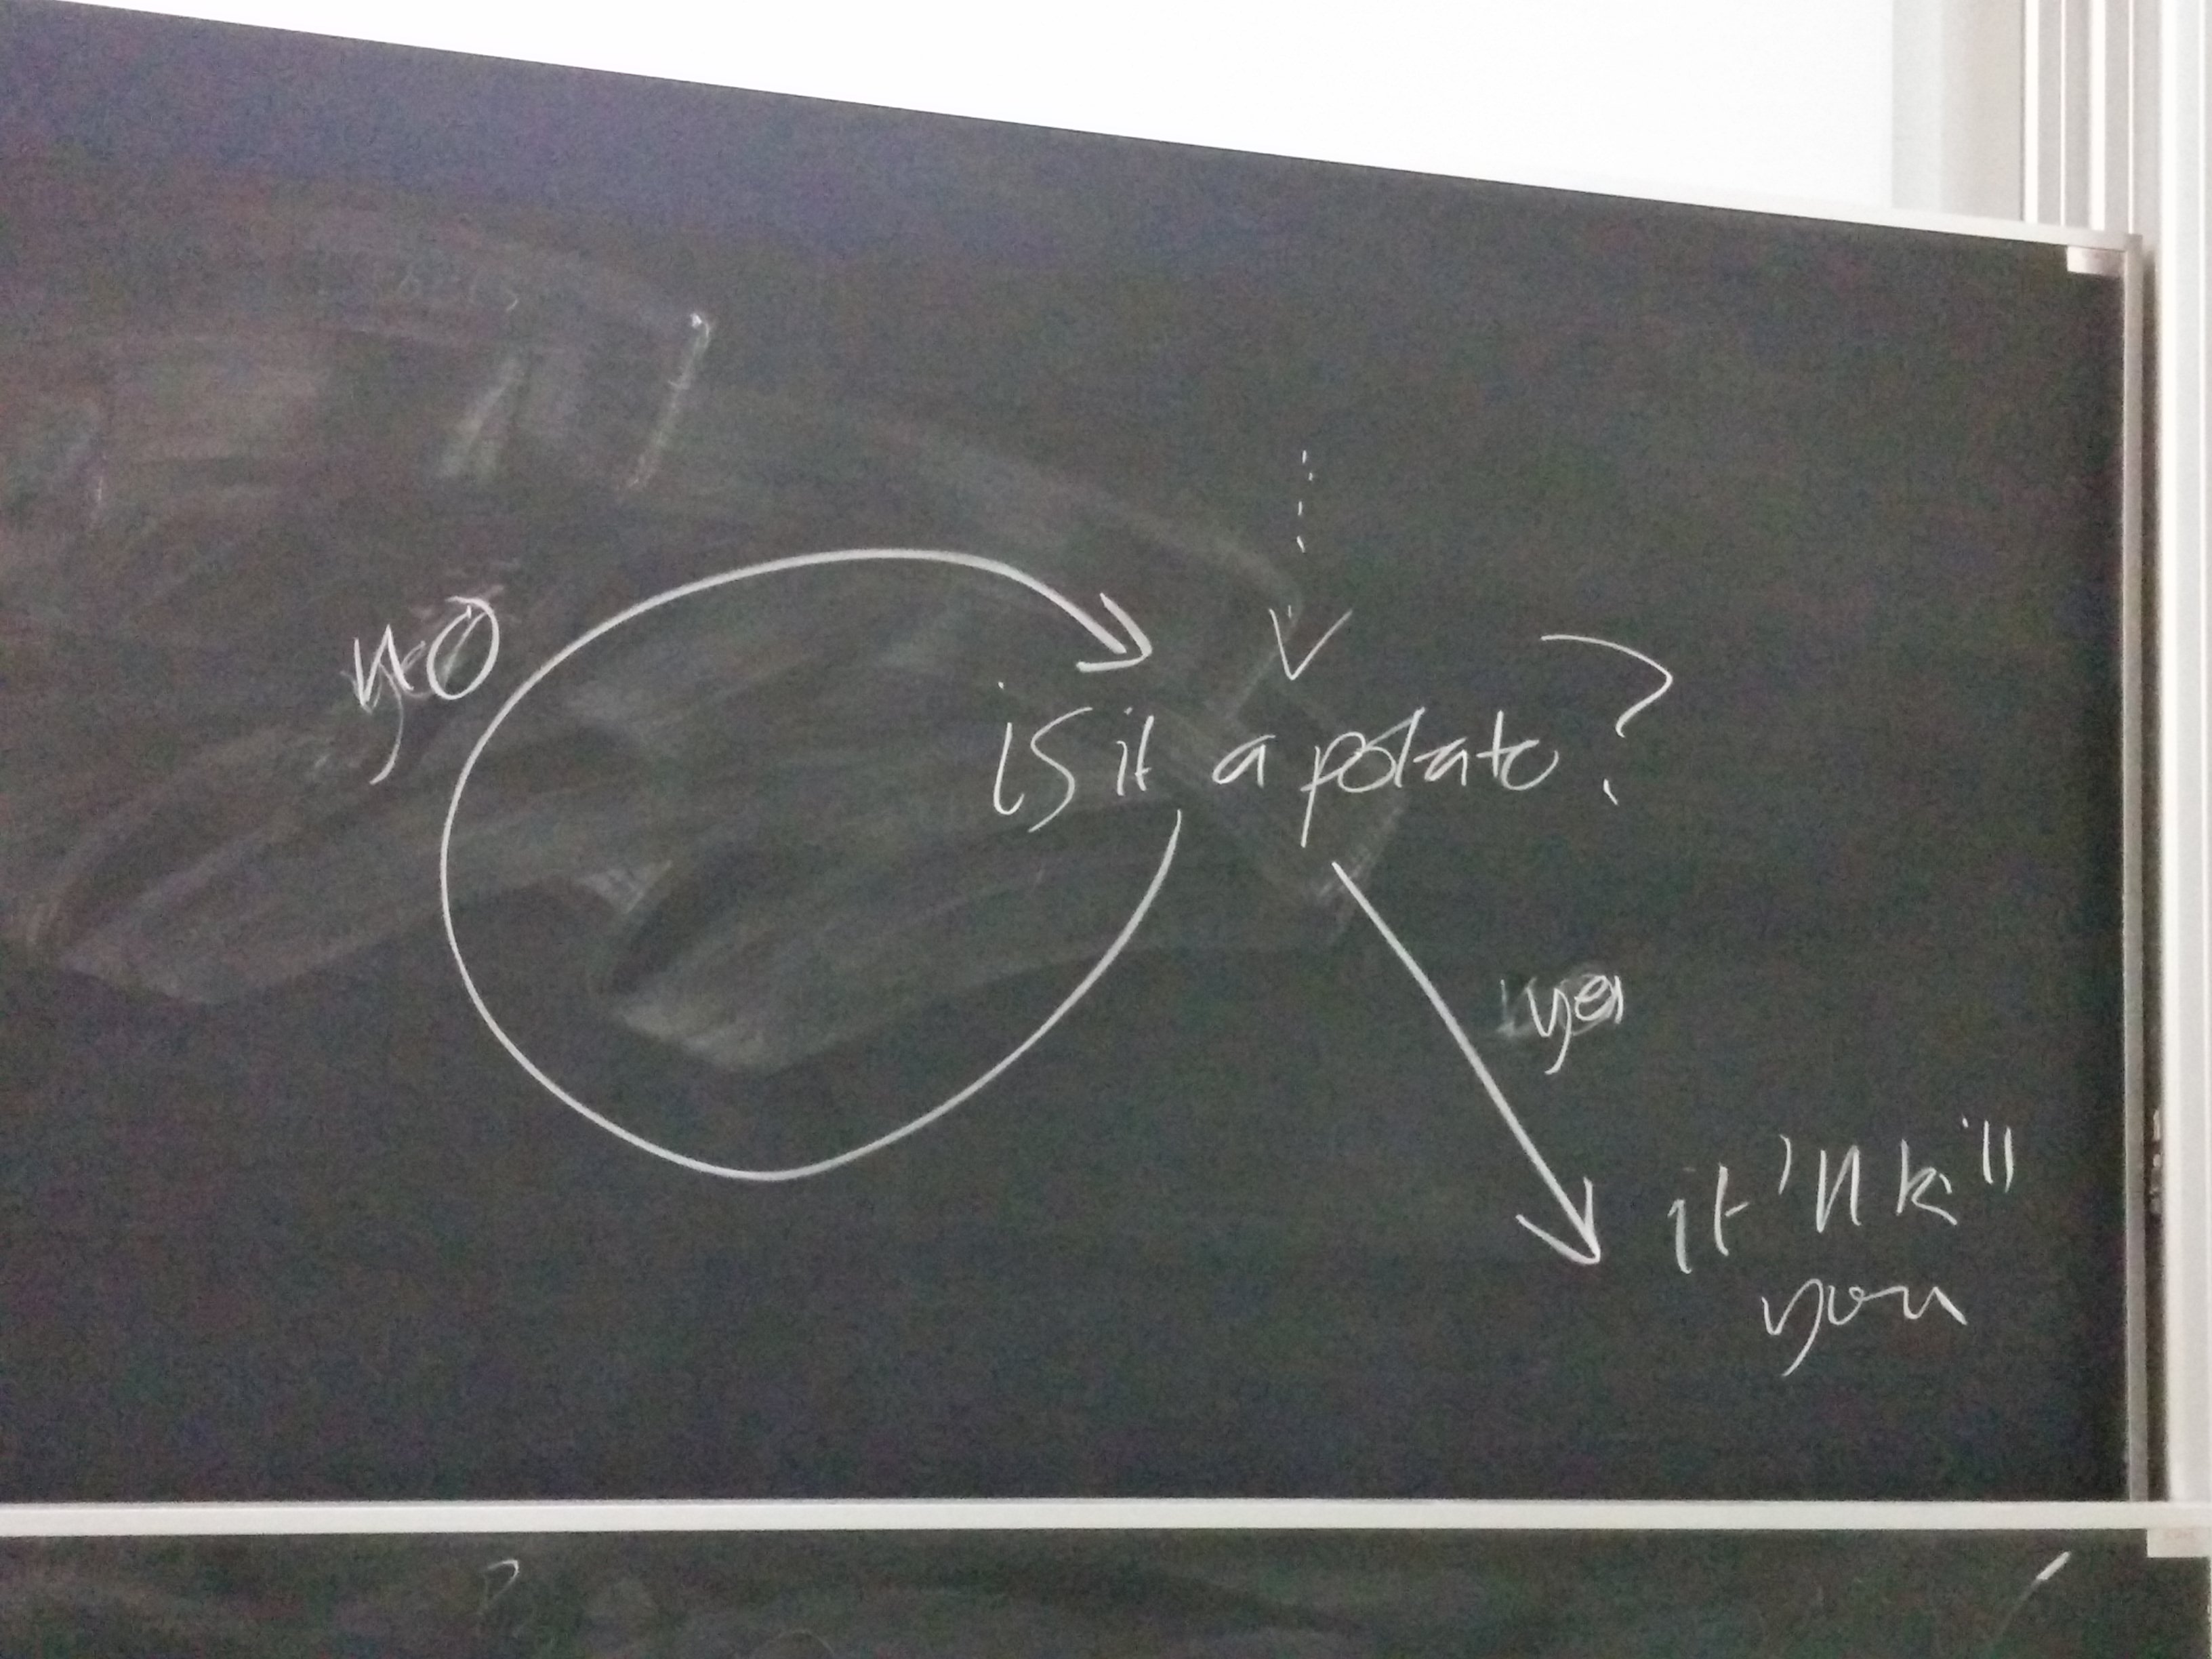
As is often the case with graphical representations, this one is quite accessible to humans - we could see how to use it - but wouldn't be much good as a representation of the same information for use by a computer. It has some usability issues; for example, it's not made very clear visually where to start. It has one frank bug: where should we go if we answer No to "Did it have a face?"?
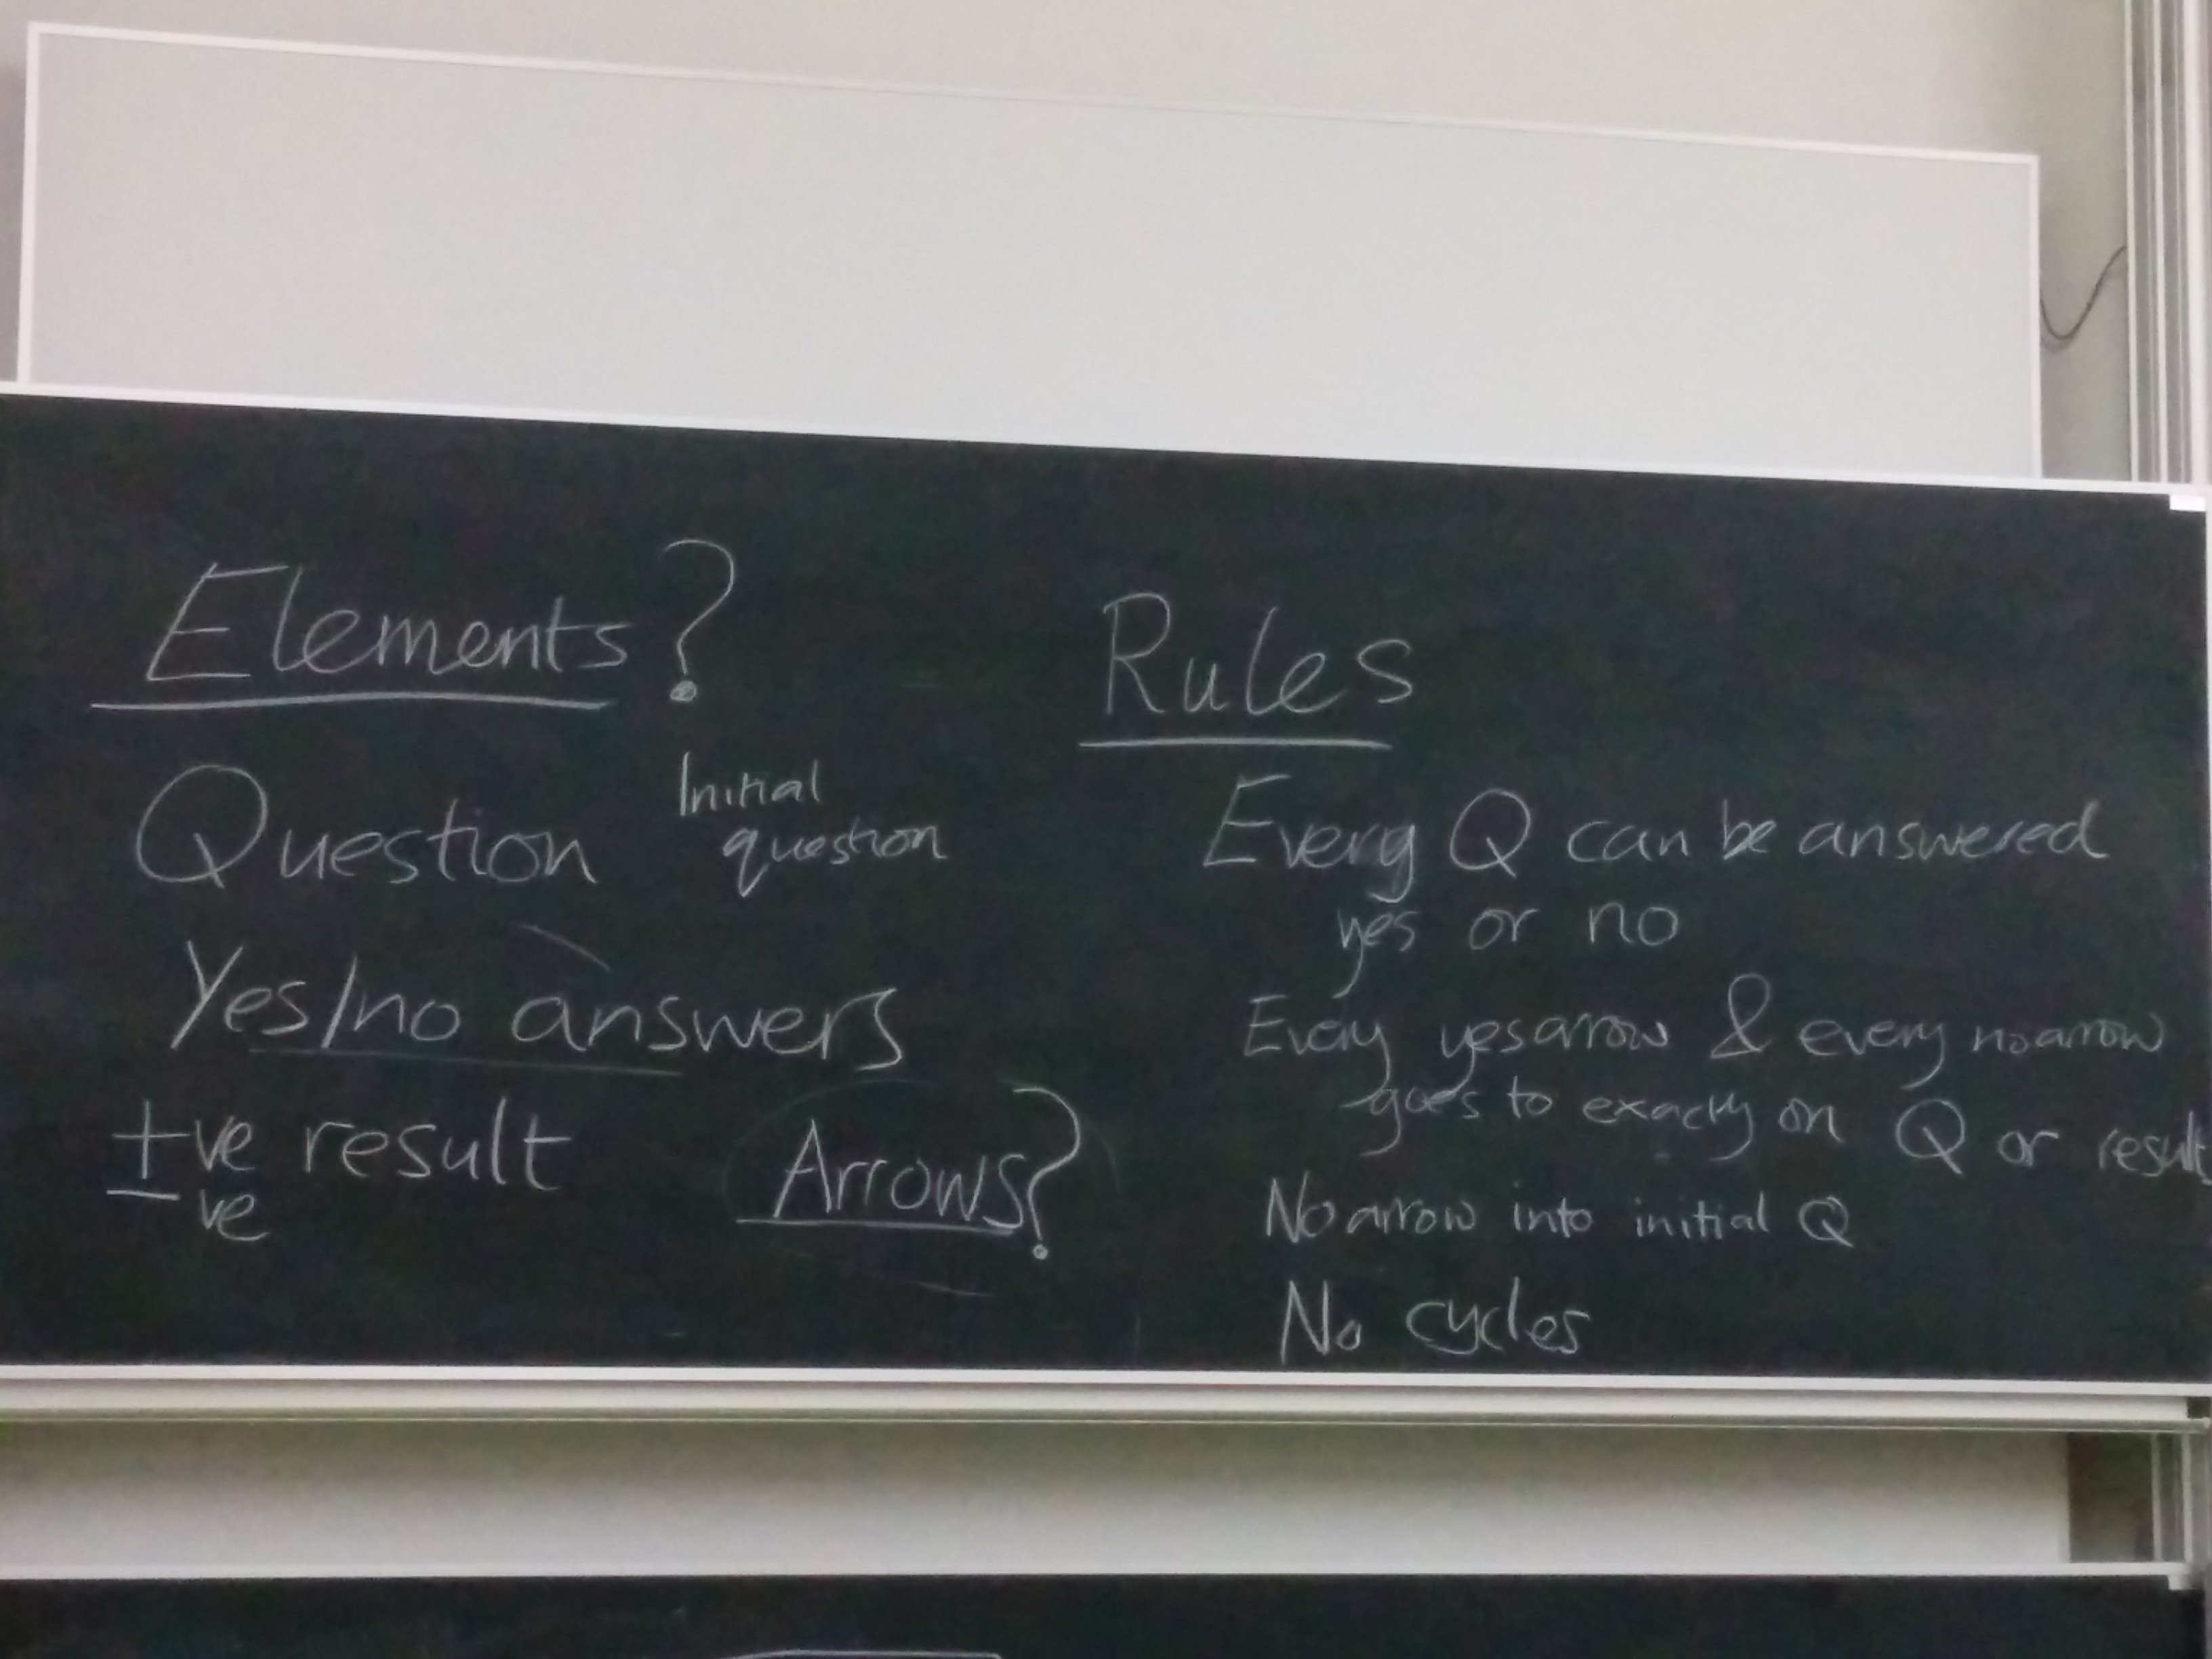
Some of the things we discussed were:
which we agreed was a good rule because diagrams with cycles are undesirable as they fail to fulfil the apparent purpose of letting someone answer the question about whether a food is paleo or not. We noted that the example isn't a tree, though it's arguable that it would be better to insist that these diagrams were trees; currently reusing results or not seems to be driven by graphical considerations.
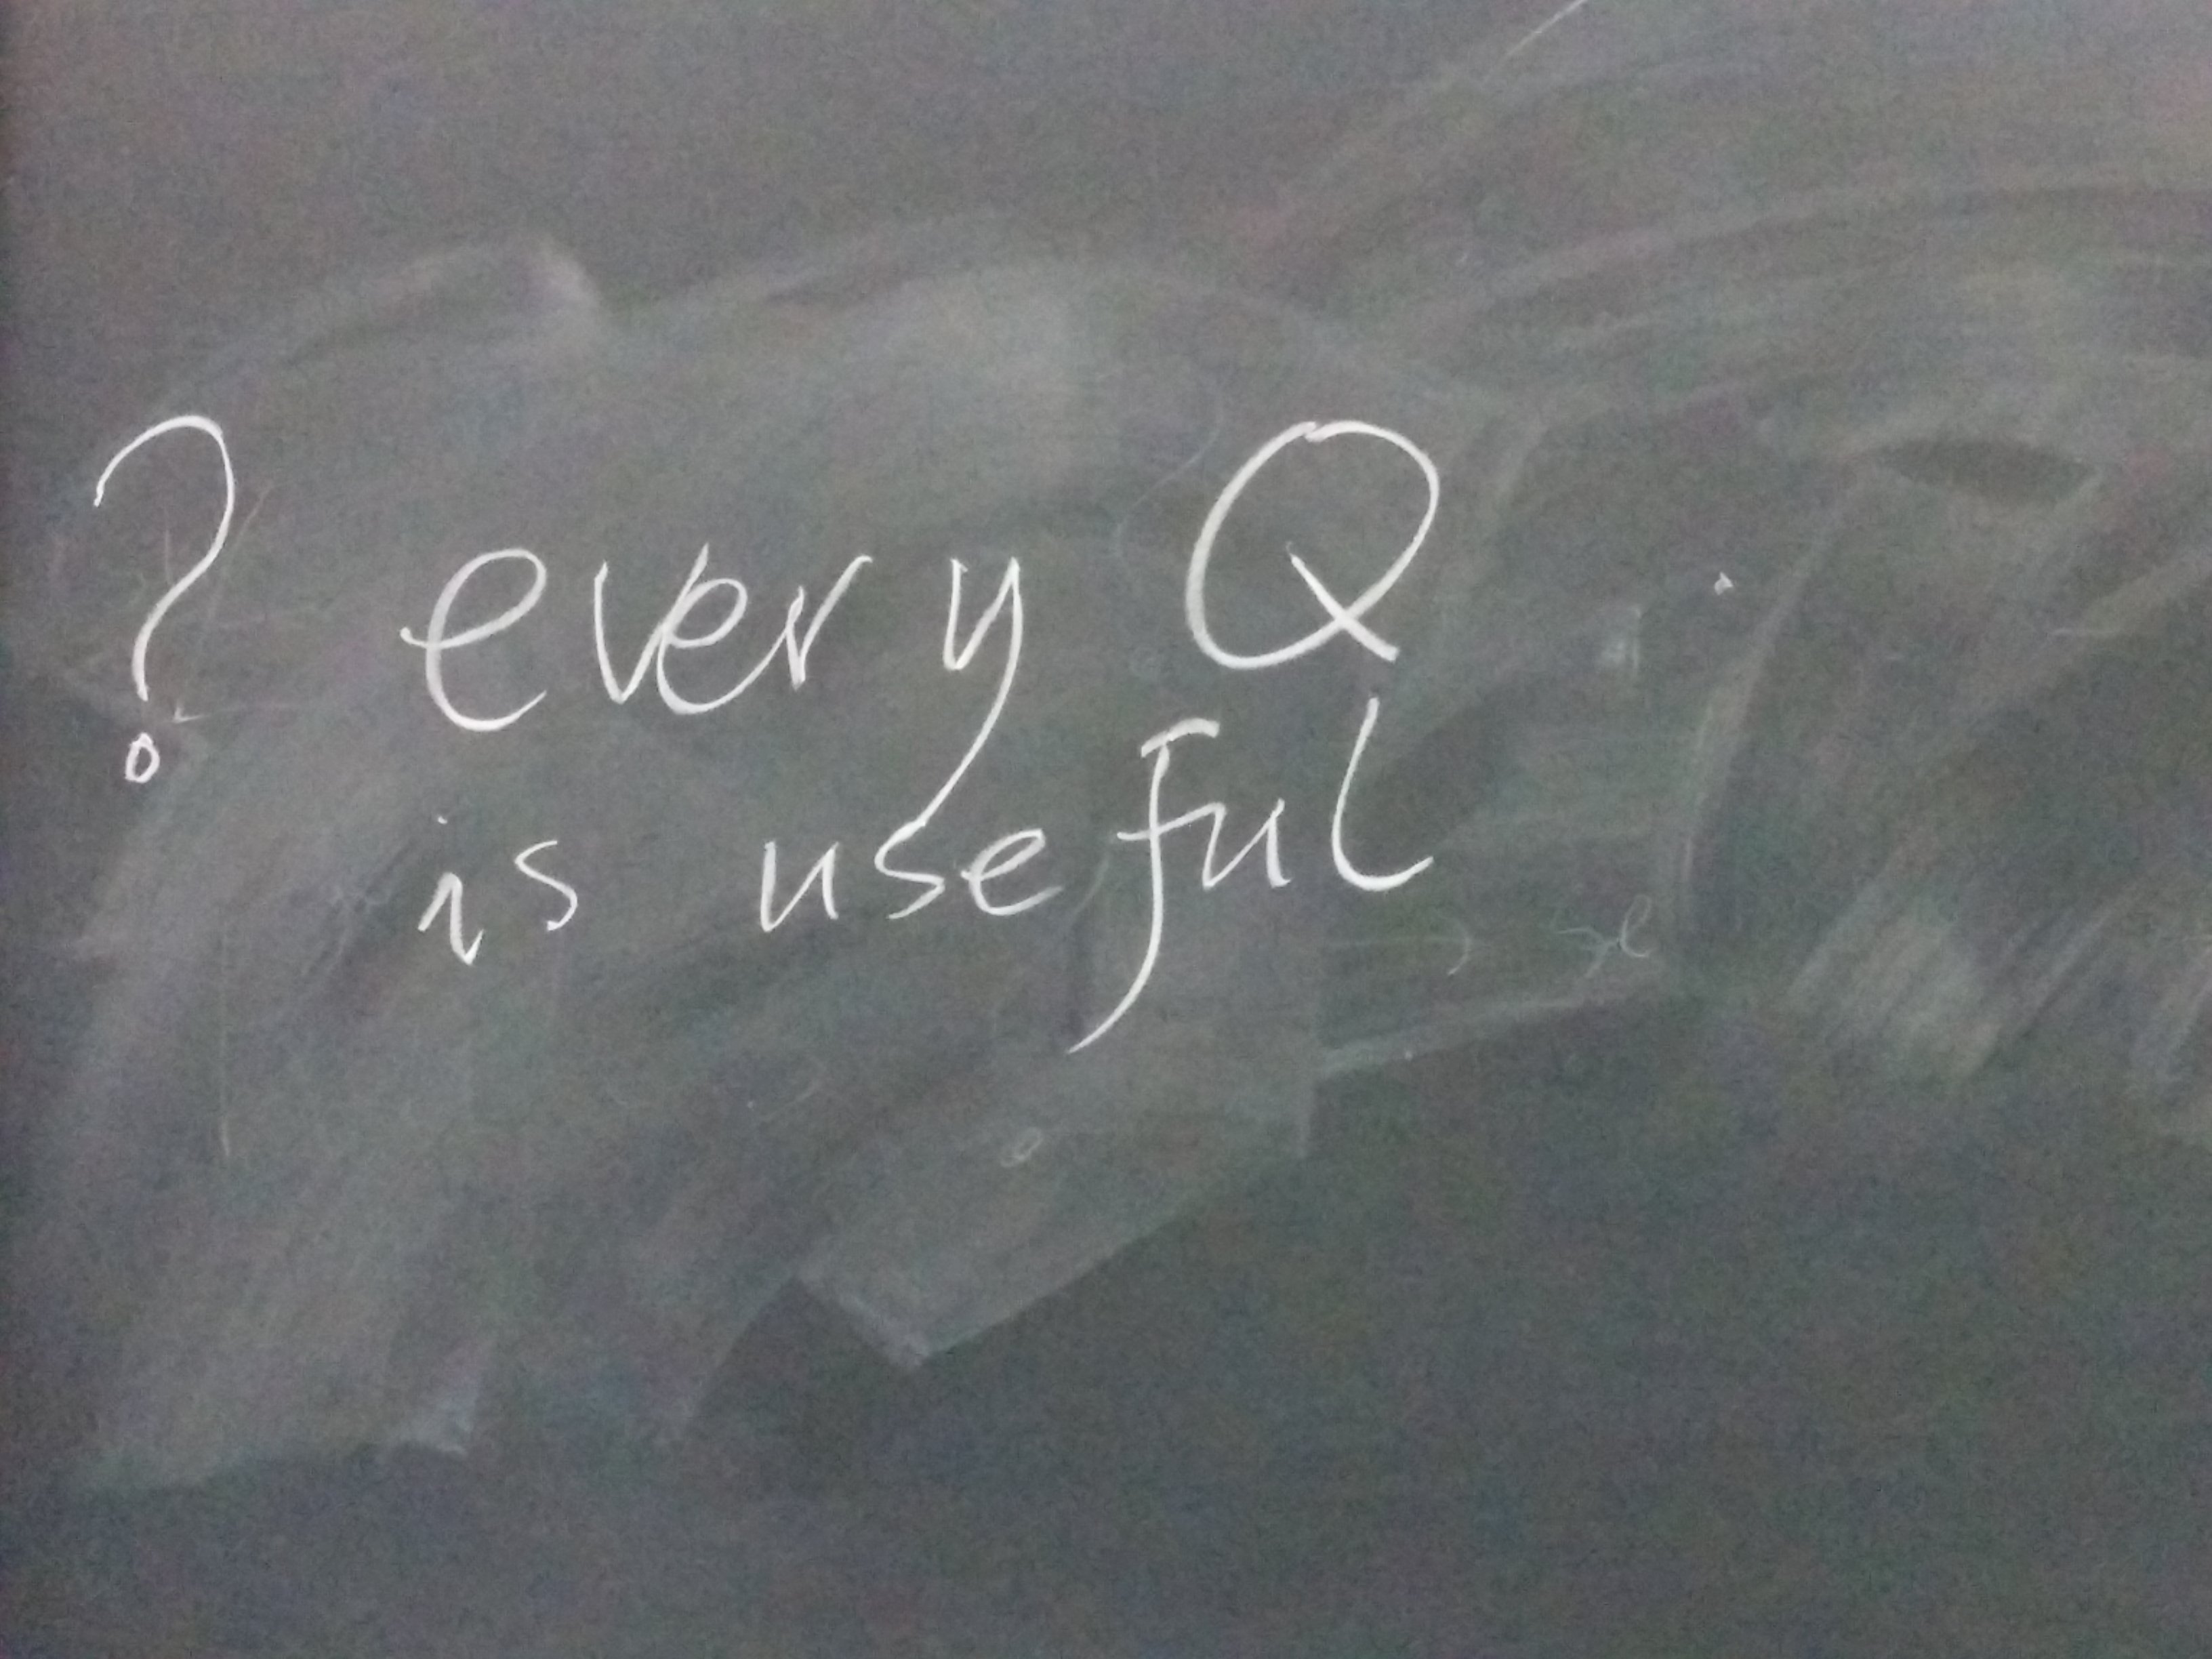
That led on to what else we might want to forbid. We discussed properties like "from every question, it should be possible to give a sequence of answers that leads to a positive result, and a sequence of answers that leads to a negative result". That's potentially useful because, if this doesn't hold, there's no point in asking the question: we already know the result. Similarly, if the yes and no branches from a question led to isomorphic subgraphs, asking the question is useless. It wasn't obvious that there might not be more cases of this issue, which we could sum up as saying that each question should be useful:
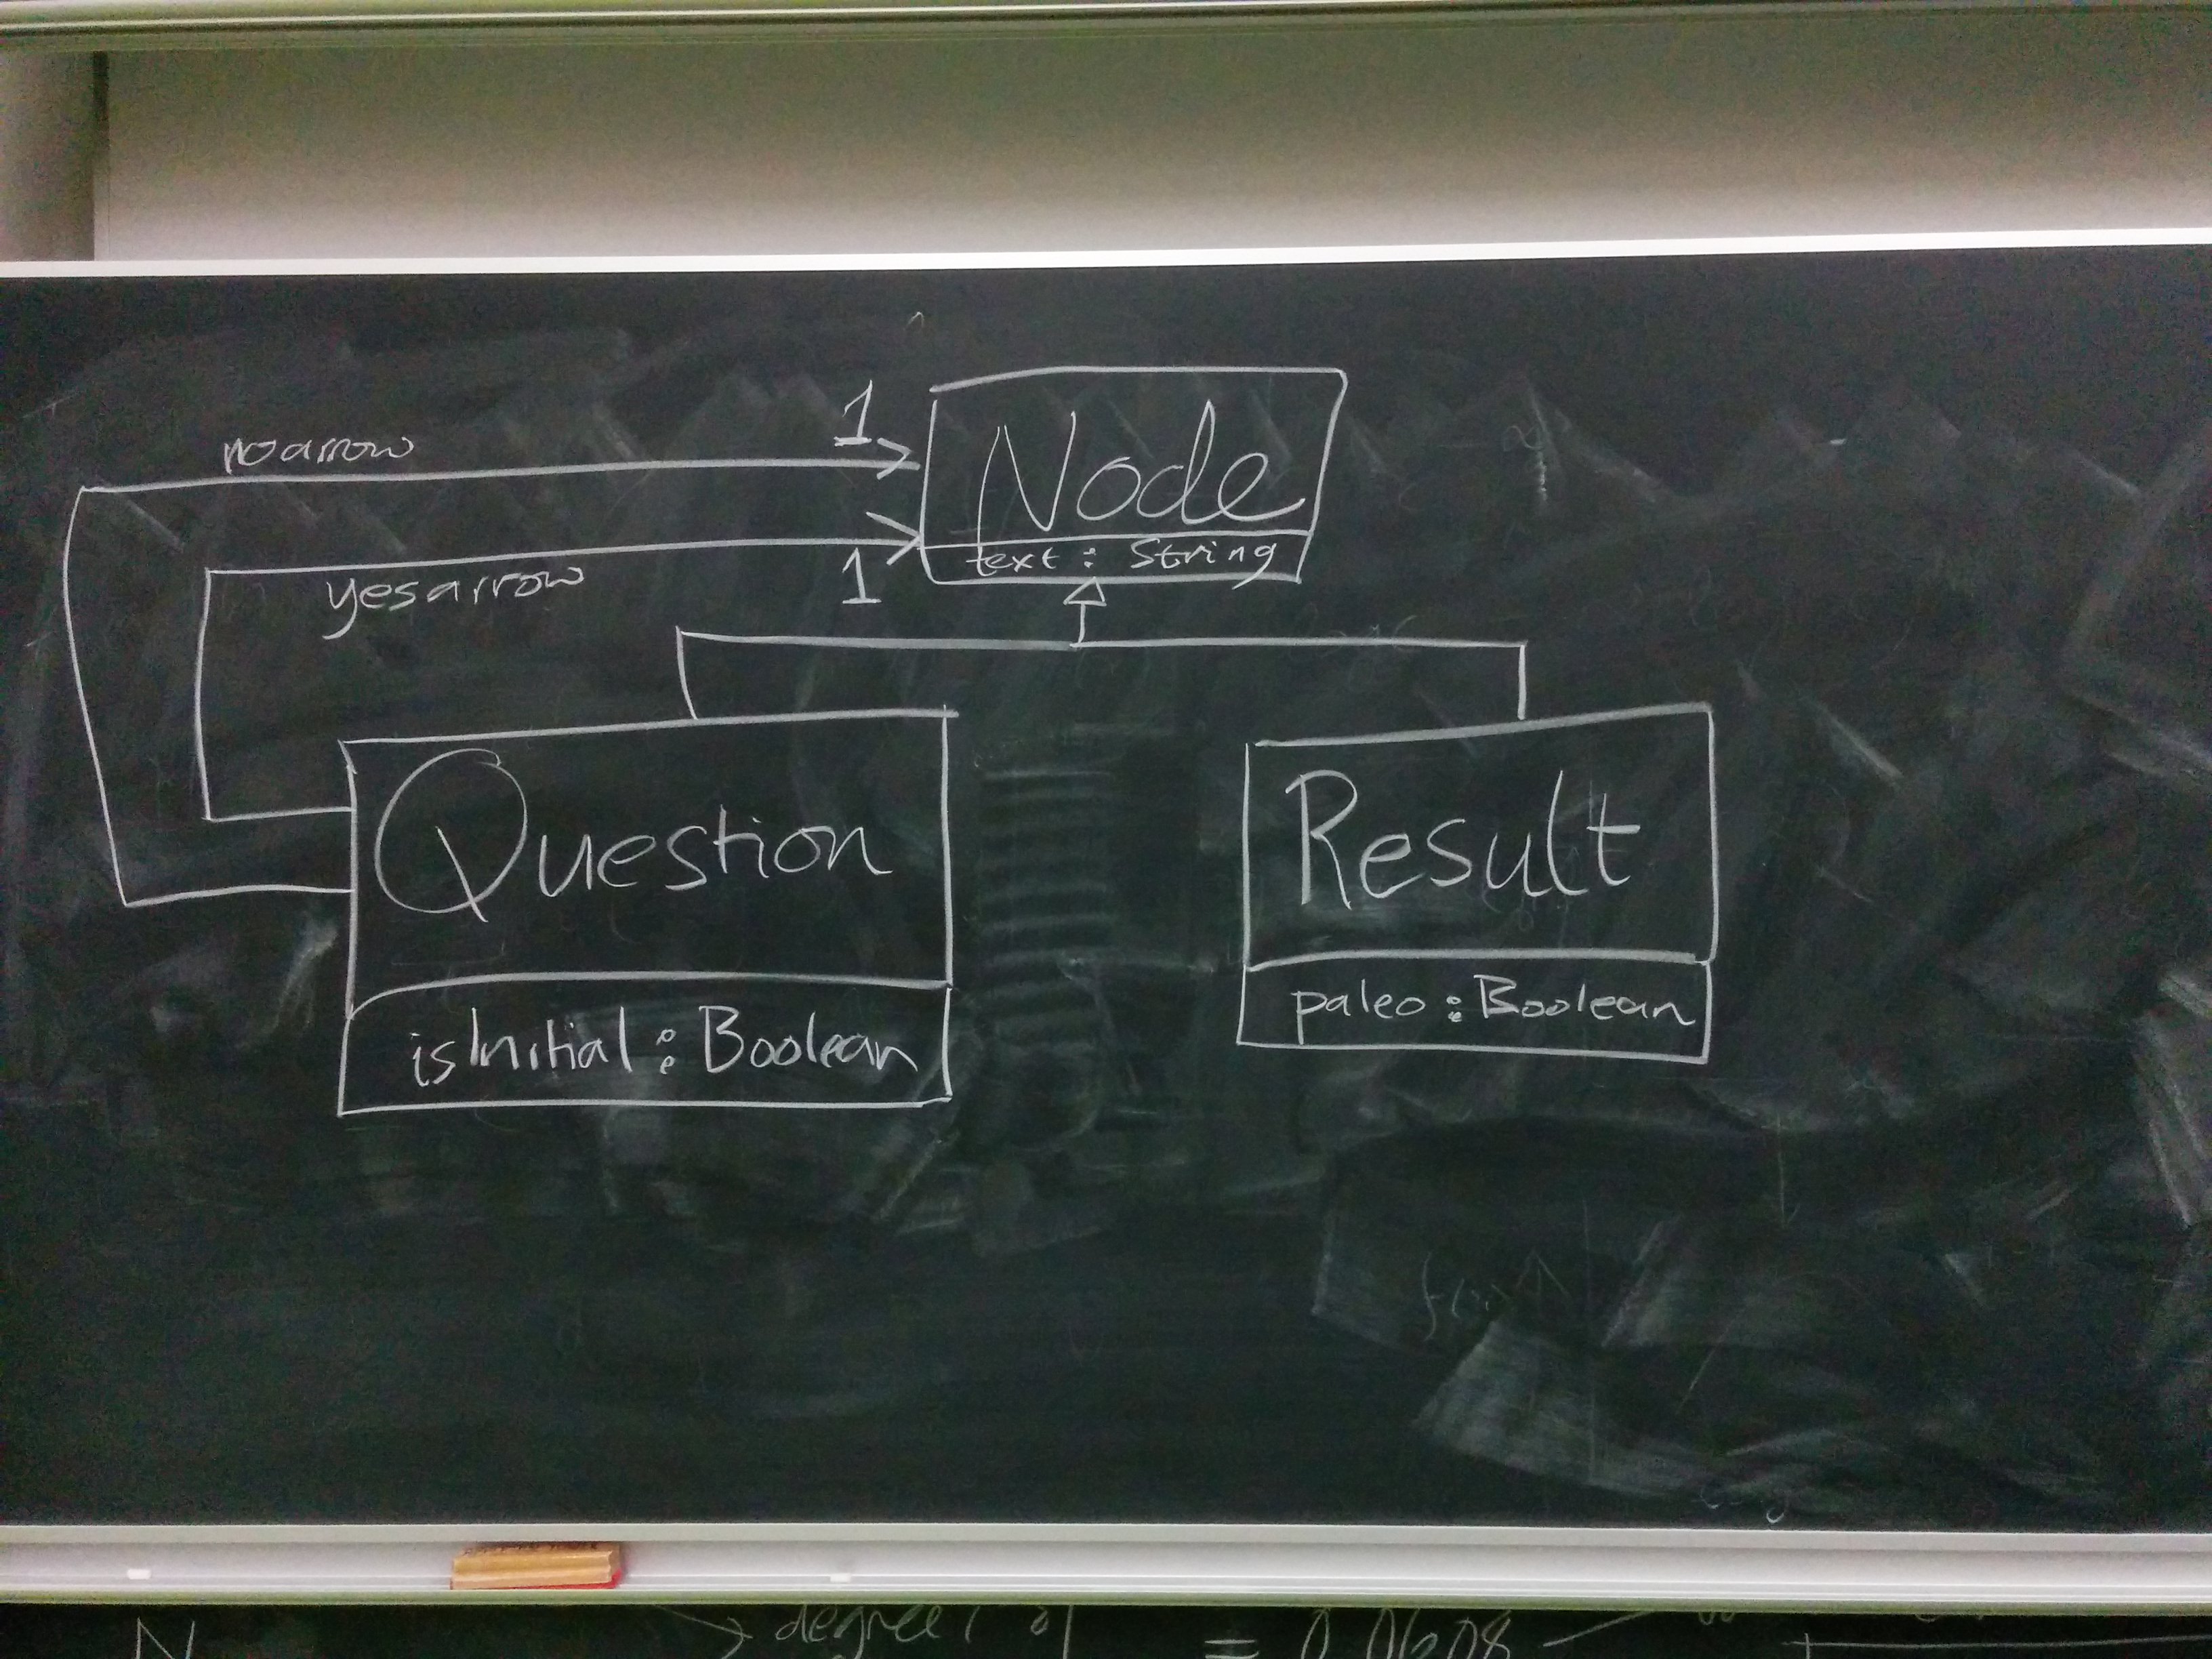
Looking at the elements board, I first put up classes Question and Result. The questions in the diagram should correspond to instances of Question, and I decided to put a boolean attribute isInitial to represent whether a question was a starting point or not. I also gave Result a boolean attribute paleo to record whether a given result element was positive or negative.
Then we ran into a problem: how to show the yes-arrows and no-arrows? Since there's no data associated with those - every yes-arrow is nothing more than an arrow, labelled yes, from one question to another question or to a result - it seemed reasonable to represent these as associations coming from Question. But to where? If we had an association yes-arrow to Question, and another to Result, we'd have no easy way to show that you shouldn't have two yes-arrows, one to a Question and one to a Result, from the same Question. Someone solved this by suggesting a common generalization of Question and Result, which I called Node. Then we could add an association called yes-arrow from Question to Node, with a 1 multiplicity at the Node end, indicating that any Question leads by a yes-arrow to one Node, which could be a Question or could be a Result. Similarly, we can have another association called no-arrow between the same places. We end up with:
Now, some of our rules are encoded directly in the diagram. Others, notably "no cycles" and "every question should be useful", aren't and can't be. We can leave those in English, or we can use a formal language such as the Object Constraint Language which forms part of UML, to record those. We'll meet OCL later in the course.
Other answers are possible! If you don't like one of the decisions we made, try making it differently, and see if you can take that through to a metamodel and set of constraints.
perdita@inf.ed.ac.uk)
|
Informatics Forum, 10 Crichton Street, Edinburgh, EH8 9AB, Scotland, UK
Tel: +44 131 651 5661, Fax: +44 131 651 1426, E-mail: school-office@inf.ed.ac.uk Please contact our webadmin with any comments or corrections. Logging and Cookies Unless explicitly stated otherwise, all material is copyright © The University of Edinburgh |

