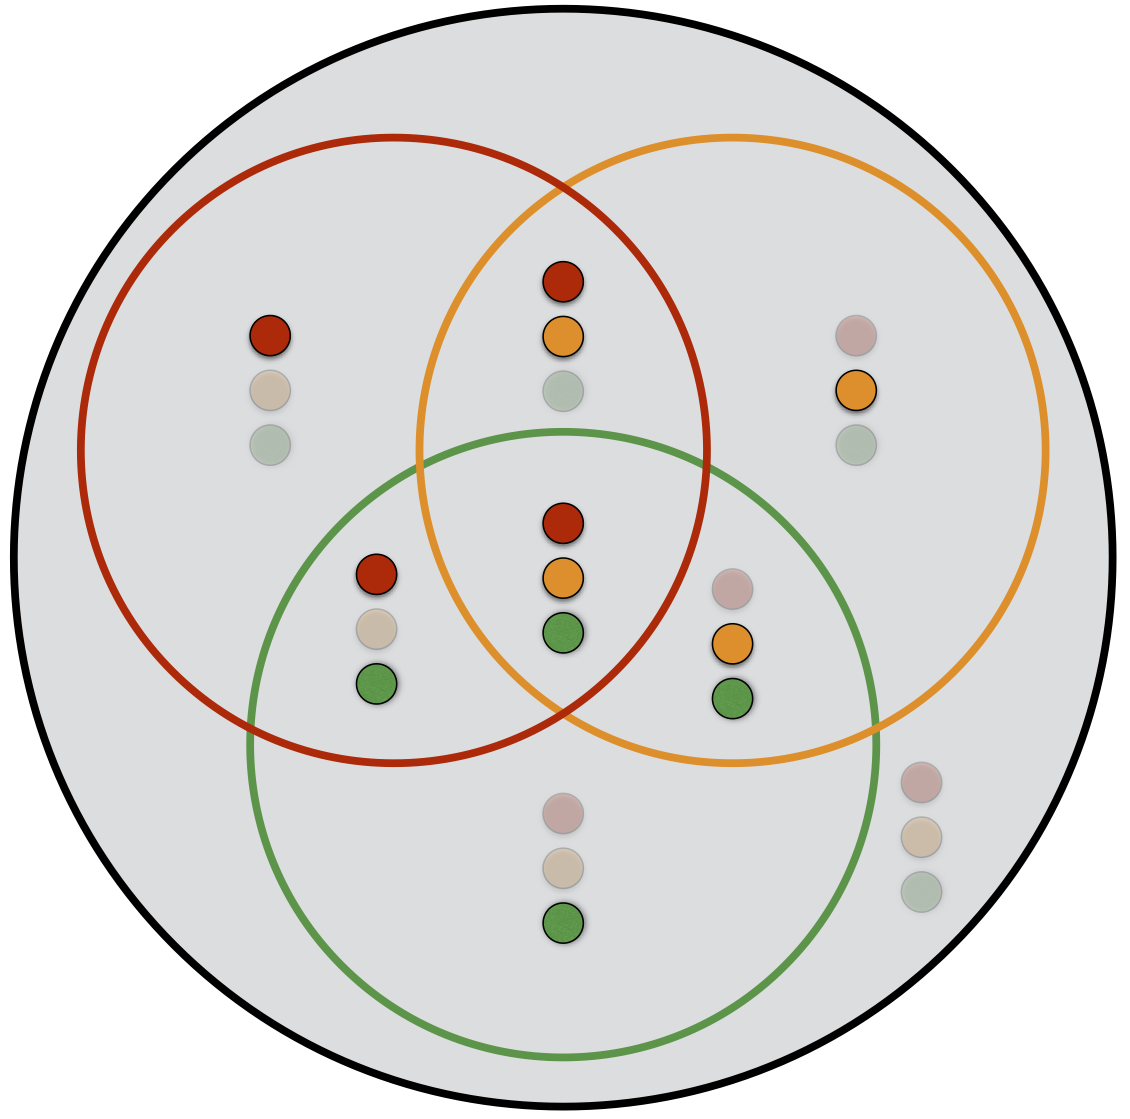
This is a tool for exploring Venn diagrams. The diagrams
presented are randomly generated.
You can change the first diagram (in the top left corner) by entering a Boolean
expression using the three propositional letters R A
G. The diagram to the left
shows the state represented by each region.
Your Boolean
expression must be written in Javascript
notation. As well as the letters || (OR), && (AND), and
! (NOT), you can use the constants true
(TRUE) and false (FALSE). You can also use the conditional
operator
condition ? expr1 : expr2
(IF THEN ELSE, or ITE), spaces, and parentheses ( ).
The text in the input box will turn red when you enter symbols other than those specified above. The Venn diagram will change whenever the text in the box constitutes a well-formed expression.
You can change the number of diagrams displayed. For example, the URL
www.inf.ed.ac.uk/teaching/courses/inf1/cl/tools/venn/?n=2
will display a 2x2 array; n can be any integer in the range 1-16.