|
This document was taken from part of the Hardware Basics chapter of the introductory book The Way Computer Graphics Works, by Olin Lathrop, published by John Wiley and Sons, 1997, ISBN 0-471-13040-0.
In this chapter, we'll talk about how to get all those neat pictures out of the computer so that you can see them. It's useful to understand some of this, since it affects what we might want to do, and how we go about it. There will also be some buzz-words that are worth being exposed to.
A spot on the phosphor lights up brighter as more electrons hit it. It starts getting dimmer when electrons stop hitting it. It stops emitting light only a short time later.
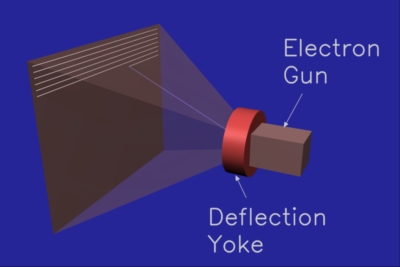
The electron gun produces a thin stream of electrons. The electron flow rate, also called the beam current, is controlled by the monitor's electronics. The stronger the beam current, the brighter the phosphor will light up. The deflection yoke magnetically steers the electron stream so that it hits the phosphor at the desired spot. This is also under control of the monitor's electronics.
|
So, all a CRT really does is to cause a selectable spot on its screen to shine with a selectable brightness.
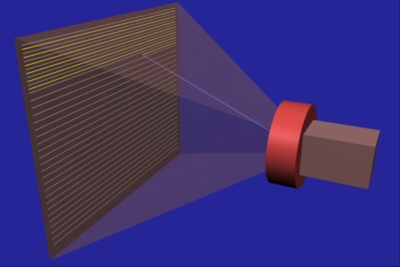
The dot that can be lit up is rapidly swept across the CRT face (by re-aiming the electron beam) in a pattern called a raster scan. The dot typically starts at the top left corner. It's then swept across to the top right corner. The electron beam is temporarily shut off while it's re-directed to the left side of the screen. The beam then scans across the screen just a little below the previous scan line. This process continues until the beam finally sweeps the bottom scan line, then the whole process is repeated.
An image is formed on the monitor screen by modulating the beam current as the lit dot is moved around. High beam currents make bright areas, and low beam currents make dim areas. The raster scan pattern maps nicely to the pixels in an image. Each horizontal traverse of the beam displays one horizontal row of pixels. The pixel values within each scan line are used to control the beam current as the beam sweeps across the screen.
Figure 4 shows six whole scan lines, with the seventh still being drawn. The point of a raster scan is to eventually hit every spot on the screen, so the scan lines overlap a little. Figure 4 shows spaces between the scan lines only to help you understand a raster scan.
So why don't we just see a dot flying around the screen instead of whole areas lit? There are two reasons for this. First, your eyes continue to perceive light for a short time after the light has gone away. This is called persistence of vision. Second, a phosphor spot keeps glowing a little while after the beam goes away. This is called phosphor persistence. Therefore, as long as the spot is swept over the whole screen fast enough, it will appear as a steady area of light, instead of a flying spot of light.
So how fast is fast? Today's monitors typically scan the entire screen 60 to 80 times per second. If they went much slower, the image would appear to flicker.
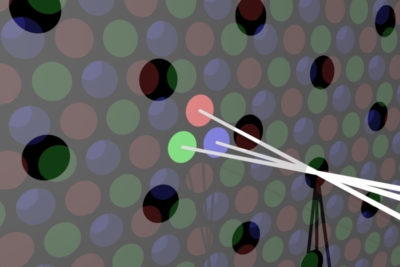
While electron beams don't come in different colors, phosphors do. To make a color CRT, little phosphor dots for each of the three primary colors (red, green, blue) are arranged on the monitor screen. Then, three electron guns are used, one for each phosphor color.
The tricky part is to make sure each electron gun can only hit the phosphor dots for its color. This is done by arranging three dots of different colors in groups, called triads. Since there are now three electron beams coming from three separate guns, each hits the phosphors from a slightly different angle. A thin sheet called the shadow mask is suspended in front of the phosphors. The shadow mask has one hole for each triad, and is arranged so that each beam can only "see" the phosphor dots for its color. Take a look at Figure 5.
|
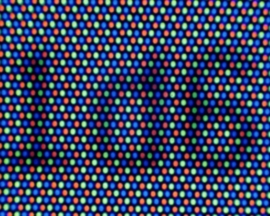
In case that just sounds too flaky to be true, see Figure 6.
| 
|
It's important not to confuse phosphor triads with pixels. Pixels are the individual color values that make up the image stored in the computer. Phosphor triads happen to be a hack to get CRTs to display colors. The whole mechanism of three beams, a shadow mask, and phosphor triads only exists to provide separate red, green, and blue color control over the lit spot on the CRT face. As long as there are enough triads so you can't see individual ones, you can think of the CRT face as being continuous. The triads are arranged in a hexagonal pattern, while pixels are in a rectangular pattern. A CRT could be made where the shadow mask and triads are rotated a bit from horizontal with little overall effect.
Does the whole mechanism of three beams, a shadow mask, and phosphor triads sound a bit flaky? It is. How do you make sure the three beams hit exactly the same spot as they are swept across the screen? What if they don't? What if the shadow mask is off a little and the beams don't just hit the spots for their colors? Well, these are real problems.
The degree to which all three beams line up to converge to one spot is called convergence. A monitor that is poorly converged looks blurry, and shows color fringes around the edges of objects.
The degree to which each beam only hits the phosphor dots for its color is called color purity. If a CRT has poor color purity, colors will look less vivid, and there may be patches of tint here and there. For example, the top right corner may be more reddish, whereas the top left corner more greenish.
All this is very sensitive to magnetic fields, since they can affect the electron beam paths. To prevent metal in the monitor chassis from becoming magnetic, any built up magnetism must be periodically removed. This process is called de-Gaussing, and is usually done automatically every time the monitor is turned on. Listen for a low hum lasting about a second right after a monitor is switched on.
Keep in mind that while many salesmen are quite knowledgeable, there are also far too many that don't really understand what they're talking about. Unfortunately, it's up to you to know what you want and to sort fact from fiction.
In general, any specification is measured to appear as favorable as possible, as long as there is some remote justification for doing so. It would be nice if specifications were for what end users really get. Yeah, right.
I'm writing this on a 17 inch monitor, but I measure only 16 1/4 inches between opposite inside corners of the bezel surrounding the screen. That's because 17 inches is the size of the bare CRT, not the final displayable area that I get to see. The monitor manufacturer buys 17 inch CRTs, and therefore claims to sell 17 inch monitors.
Worse yet, I can't even use all 16 1/4 inches of the visible CRT face. Most computer displays have a 5:4 aspect ratio, meaning they are 4/5th as tall as they are wide. Example 5:4 resolutions are 640x512, 1024x768, 1280x1024, and 1600x1280. After adjusting the image to the largest possible 5:4 area, I am left with only a 15 1/4 inch diagonal. I guess this means 15 1/4 = 17 in marketing math.
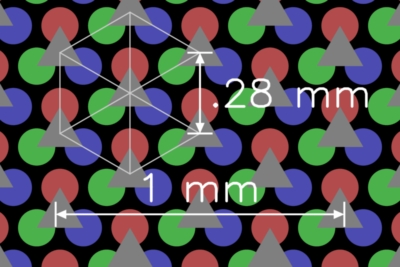
The triads are arranged in a hexagonal pattern so that each triad has six neighbors. The distance to each of these neighbors is the dot pitch. See Figure 7 for a diagram of all this.
Typical dot pitch values are in the .2 to .3 millimeter range.
|
Phosphor triads are just a means of making a CRT display colors. But, you can pretty much forget triads exist because they are deliberately so small as to present the illusion of a continuous color screen.
Pixels, on the other hand, are the digital values that are used to drive the monitor's analog controls. Each horizontal row of pixels in the display hardware is used to modulate the electron beam currents for one horizontal sweep across the screen. The exact vertical placement of the beam sweeps, and the horizontal placement of individual pixels within each sweep is without any regard to the placement, spacing, and orientation of the phosphor triads. In other words, pixels just fall where they fall, and it works because the screen can be thought of as continuous, even though it happens to be made of lots of little dots. After all, most monitors have some diddle knobs that allow you to move the image up, down, left, and right, change its size, and sometimes even rotate it slightly. Clearly, pixels can be moved around without regard to the phosphor triads.
The spacing between phosphor triads, the "dot pitch", does affect the monitor's maximum possible resolution. In other words, the visual detail in a color CRT image stops increasing as more pixels are used, once the pixel spacing is about the same as the triad spacing. For example, let's consider a monitor with a dot pitch of .28 millimeters. This means the closest spacing between triads is .28 millimeters, which means there are no more than 36 triads per centimeter, or 91 triads per inch. If you've got a 1,280 x 1,024 display, that means your monitor needs to be at least 14 inches wide to truly resolve all the pixels. This comes out to a diagonal display area size of 18 inches, which would require at least a "19 inch" monitor to achieve. In practice, the advantage of denser pixels doesn't just suddenly stop when the dot pitch is reached, but it does start to seriously fall off. You will probably still perceive a better image at 1,280 x 1024 pixels on a 17 inch monitor with .28 dot pitch than at 1,024 x 800 pixels. But, it's unlikely this would be true on a 12 inch monitor with a .28 dot pitch.
The vertical scan rate indicates how often the entire image is refreshed. This directly affects how much the image will appear to flicker. Most people will perceive a monitor image to be "flicker free" at vertical scan rates of 60 to 70 herz (60 to 70 times per second) and higher.
You may be able to see a monitor flicker by looking at it out of the corner of your eyes. Humans are more sensitive to flicker at the periphery of vision than at the spot they are looking directly at. Try this with a regular (non-digital) television. These flicker at 60 hertz in North America and Japan, and 50 hertz most everywhere else. 50 hertz is so low that many people can see the flicker even when looking directly at the screen.
Why go thru all that trouble? The apparent flicker you see comes from the vertical refresh rate, whether all the scan lines or only half are displayed each pass. For the same apparent flicker, interlacing only requires half as many scan lines to be drawn. This reduces the data rate and relaxes requirements on the monitor and graphics hardware electronics, saving money. Each vertical pass during which half the scan lines are drawn is called a field. The field containing the top scan line is called the even field, and the other is called the odd field. Both fields together, meaning all the scan lines are drawn once, is called a frame.
|
So, briefly, interlacing is a means of reducing monitor and display hardware cost, while displaying the same image with the same apparent flicker. However, there's no free lunch. Thin horizontal lines in the image will flicker quite noticeably. Since they are on only one scan line, they only get refreshed at half the vertical refresh rate. Also, interlacing introduces one more thing that can go wrong. The image will be of poor quality if the beam sweeps of each vertical pass aren't exactly half way between each other.
|
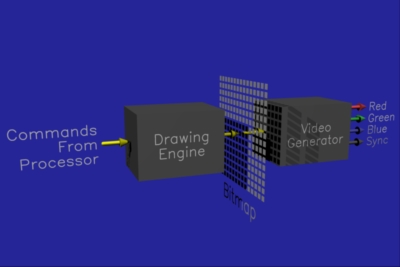
The bitmap is the heart of any display controller. This is where the pixels are kept. The bitmap divides the remaining display controller into the drawing "front end", and the video "back end." We'll talk about those first, then get back to some more bitmap details.
The drawing command set can vary greatly from one display controller to another. To give you some idea, a typical command sequence for drawing a red rectangle from 15,10 to 34,24 might be: 1 - Set current fill color to red. 2 - Set current point to 15,10. 3 - Draw rectangle, width = 20, height = 15.
Most display controllers also allow the processor to directly read and write the pixels in the bitmap. The processor could have directly written red into all the pixels from 15,10 to 34,24 to write the same rectangle as before. However, the purpose of the drawing engine is to off-load this kind of work from the processor. Not only can the drawing engine do this task faster, the processor can go do something else once the drawing engine gets started on the rectangle.
So, how does going thru an interpretation step save memory? Well, let's look at what it would take to store color values directly. As I mentioned before, it takes three numbers to describe a color. The standards for video signals that drive computer monitors use the RGB color space, so the three numbers would need to be the red, green, and blue color components. In computer graphics, we think of RGB color components as being "continuous" (you can't distinguish individual levels anymore) when there are at least 256 levels per RGB component. Since 256 levels requires 8 bits (2**8 = 256), or one byte, a full color requires three bytes. If your bitmap has a resolution of 1024x800 pixels, that would require about 2.5 megabytes for the bitmap. Memory usually comes in standard sizes, so you'd probably end up with four megabytes in your bitmap. (No, this isn't stupidity. There are good reasons for this, but they're beyond the scope of this book).
The cost of low end graphics boards is usually dominated by the cost of the bitmap memory, so we'd like to reduce the amount of this memory. Three bytes per pixel lets us store any color in any pixel, but do we really need this? Unless you are doing imaging, the answer is usually "no." Look at a typical screen with a few windows, text, menus, etc. How many different colors do you see? Probably not more than 16. Suppose we numbered each of these colors from 0 to 15. We would then need only four bits per pixel in the bitmap, but we'd have to interpret the color numbers into their real colors to generate the final RGB video signals.
In practice, we usually use eight bits per pixel instead of the four in the example. Eight bits allows up to 256 different colors on the screen at the same time. That's more than enough for the basic user interface, but also allows some way to see images, supports games, etc. 256 simultaneous colors requires one byte per pixel. The entire 1024x800 bitmap would then fit into just one megabyte with room to spare. Note that we've reduced the bitmap memory from four to one megabyte at a price. First we can only display 256 colors simultaneously, and second, we now have to interpret the color numbers into real RGB colors.
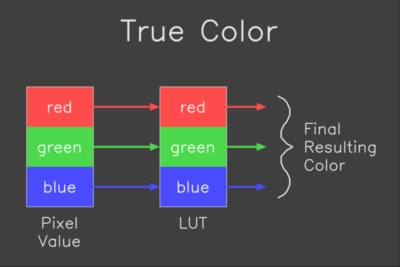
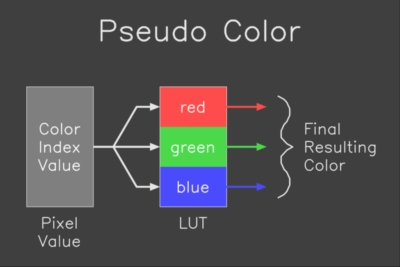
The interpretation job is done in the color lookup table, often just called the LUT. The LUT converts the color numbers, usually called the color index values or pseudo colors, from the bitmap into their assigned RGB colors. In our example, the LUT has 256 entries, since that's how many possible color index values there are. Each entry holds a 24 bit (8 bit per color component) RGB value.
|
|
While a lookup table (LUT) is required in a pseudo color system, many true color systems also use them. In that case, they can be used to compensate for some artifacts introduced by the monitor, or for special effects. In practice, most true color lookup tables are just loaded with "straight thru" data, and you can usually forget them.
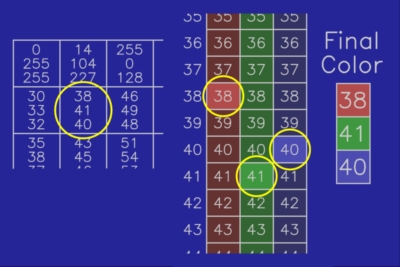
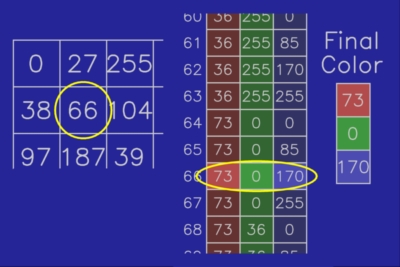
Let's do some examples to make sure the true color versus pseudo color distinction makes sense.
|
|
DRAM stands for Dynamic Random Access Memory. I won't go into what that means, except that DRAM is the "normal" kind of memory that is also used to make the main memory in your computer. VRAM stands for Video Random Access Memory, and is specifically designed to function as bitmap memory.
The drawing front end can independently write into a VRAM bitmap while the video back end is reading the pixels. In a DRAM bitmap, the front and back ends have to share. In some DRAM configurations, the back end can hog the bitmap up to 80% of the time. This doesn't leave much for the front end, and slows down drawing operations. Of course there's always a tradeoff, which in this case is price. VRAMs cost about twice what DRAMs cost for the same amount of memory.
What do I recommend getting? That's kinda like asking whether I recommend a station wagon or a sports car. In general, though, I wouldn't shell out the extra mula for VRAM unless I knew I'd be running drawing-limited applications where performance is important. If you're not sure about that, just get DRAM.
In practice, even low end systems usually have hardware support for simple 2D drawing. The incremental cost of adding such a drawing engine is small compared to the bitmap and the video back end cost. Such a system is sometimes referred to as a 2D display controller or graphics board, or GUI engine. GUI stands for "graphical user interface" and refers to these kinds of operations.
There are systems available with just about any imaginable tradeoff between what's in hardware and what the software must do. Marketing types, however, like fancy labels to make their product sound more sophisticated than the next one. Some "standard" names have emerged for some configurations. I'll make you aware of them, but keep in mind this is a moving target since companies can (and often do) make up new names, and use old names in new ways.
I've already mentioned 2D or GUI engine. This usually means a minimal drawing engine that's good at simple 2D lines, points, rectangles, pixel copies, and maybe some polygons (we'll get into what these are in the next chapter). That's all that's needed by most window systems for menus, text, popups, etc.
A 2 1/2 D display controller is intended for drawing 3D objects, but doesn't have true 3D capability. It provides the 2D support needed for 3D drawing. This usually includes allowing the color to vary across the object being drawn, dithering, and Z buffering.
A full 3D display controller understands true 3D commands. It must do transformations, lighting, and other advanced effects that don't make sense to talk about until you've read the Rendering chapter.
Technology keeps marching on. In the current trend, the cost of logic for implementing drawing engines is falling faster than the cost of the bitmap and the video back end. If this continues, we will see ever more capable "low end" systems. Who knows what tomorrow brings?
|
Informatics Forum, 10 Crichton Street, Edinburgh, EH8 9AB, Scotland, UK
Tel: +44 131 651 5661, Fax: +44 131 651 1426, E-mail: school-office@inf.ed.ac.uk Please contact our webadmin with any comments or corrections. Logging and Cookies Unless explicitly stated otherwise, all material is copyright © The University of Edinburgh |

